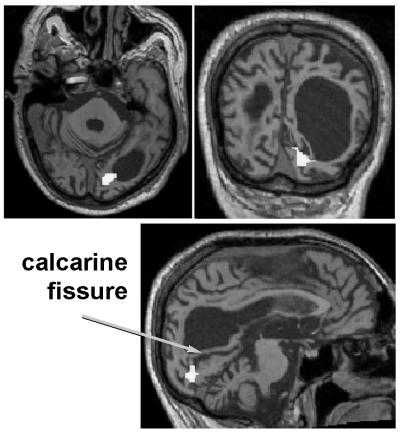
Figure 2.
Co-registered structural and functional MRI data from the patient PB showing, in coronal, sagittal, and transverse sections, the activation in the calcarine fissure (V1) during stimulation with a colored display. The white area shows the cluster of voxels exceeding an uncorrected significance level of <0.001.

