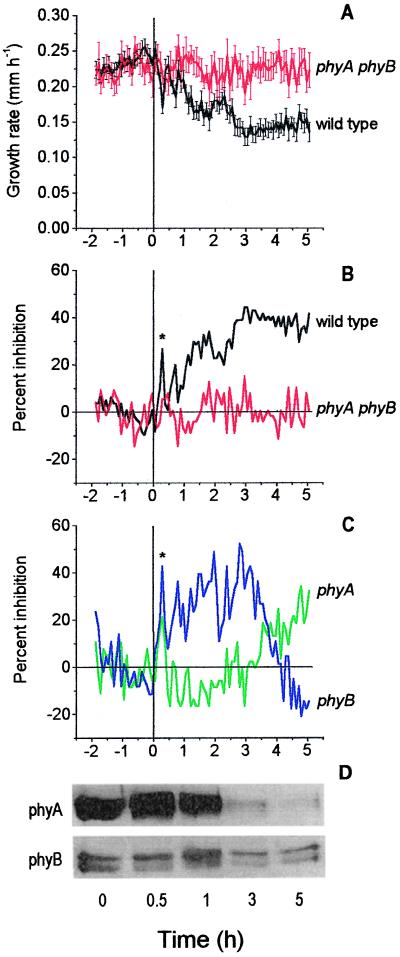
Figure 2.
The effect of RC on the growth responses and phytochrome levels of Arabidopsis seedlings. Seedlings were approximately 3 mm tall for growth rate measurements performed by using CCD image capture. (A) Growth rate data for wild-type and phyAphyB double mutant seedlings. Traces shown are the average of 19 and 11 separate measurements for the wild type and the double mutant, respectively. Bars representing 1 SEM are shown at 5-min intervals. (B) Representation of data in A is shown as an inhibition time series, calculated according to Eq. 1 in the text. (C) Inhibition time series showing the averaged responses of 10 phyA and 9 phyB seedlings to RC. For all growth-response curves, RC (250 μmol⋅m−2⋅s−1) was initiated at time zero (vertical line). (D) Immunochemically detectable phyA and phyB in enriched wild-type protein extracts are measured as a function of exposure to RC (250 μmol⋅m−2⋅s−1). Each lane was loaded with 20 μg of total protein. The doublet seen on the phyB blot probably represents partial degradation of the polypeptide (17). The asterisks shown in B and C denote the early transient phase of growth inhibition. The x-axis labeling at the bottom of the figure applies to all of the panels in this figure.

