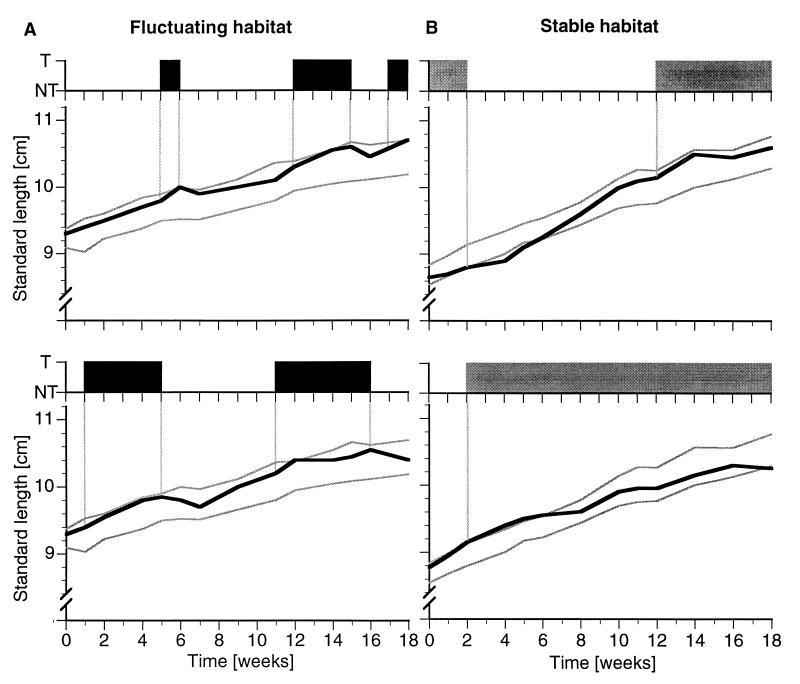
Figure 6.
Standard lengths and social histories of representative individuals from fluctuating (A) and stable (B) environments. The top of each panel shows the social status of the respective animals over the course of the experiment (T, territorial; NT, nonterritorial). At the bottom of each panel, the standard lengths (black line) of this individual and the standard deviations (gray lines) of the size distributions of the respective male population are shown. In both conditions, animals grow faster while they are NT and often slow down while they are T, as can be seen by the different slopes. Standard length typically increases when an animal becomes territorial (NT→T) and often decreases when it becomes nonterritorial (T→NT).

