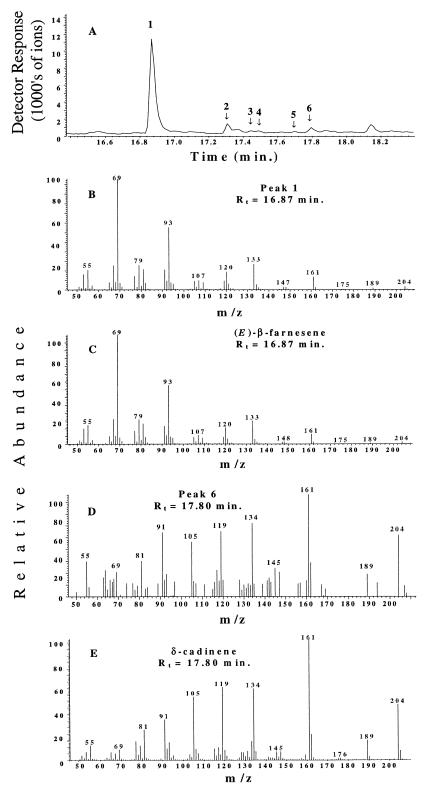
Figure 3.
GC-MS of the products generated from FDP by the recombinant (E)-β-farnesene synthase. (A) Total ion chromatogram. Numbered peaks are sesquiterpene olefins. (B) Mass spectrum and retention time of peak 1 designated in A. (C) Mass spectrum and retention time of authentic (E)-β-farnesene from parley oil. (D) Mass spectrum and retention time of peak 6 designated in A. The spectrum of this minor product is compromised by the low ion abundance and the corresponding prominence of background ions. (E) Mass spectrum and retention time of authentic δ-cadinene.

