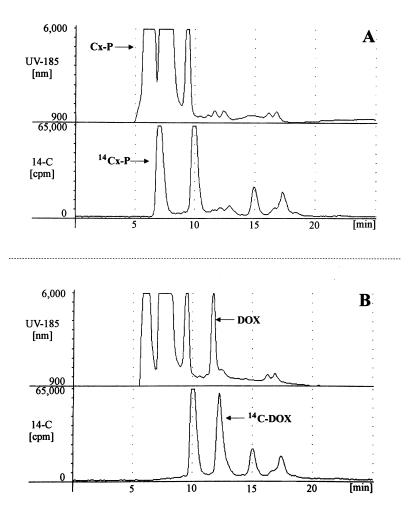
Figure 4.
UV (A185) and 14C elution profiles of DXP synthase assay mixtures after HPLC on an Aminex HPX-87H column (Bio-Rad). The column eluate was directed through a UV (arbitrary units) and a radioactivity monitor connected in series. (A) UV and 14C elution profiles of the assay mixture with cell-free extract of E. coli JM109 pUCBM20dxs after 2 h of incubation at 30°C. Phosphorylated (Cx-P) and 14C-labeled reaction products (14Cx-P) appeared in the void volume. (B) Elution profiles of the assay mixture shown in A after treatment with alkaline phosphatase, showing a novel UV and 14C peak (DOX, 14C-DOX). Peaks at retention times of 9.3 min (UV) and 10.0 min (14C) represent pyruvate; other peaks stem from components of the assay mixture or other reaction products.

