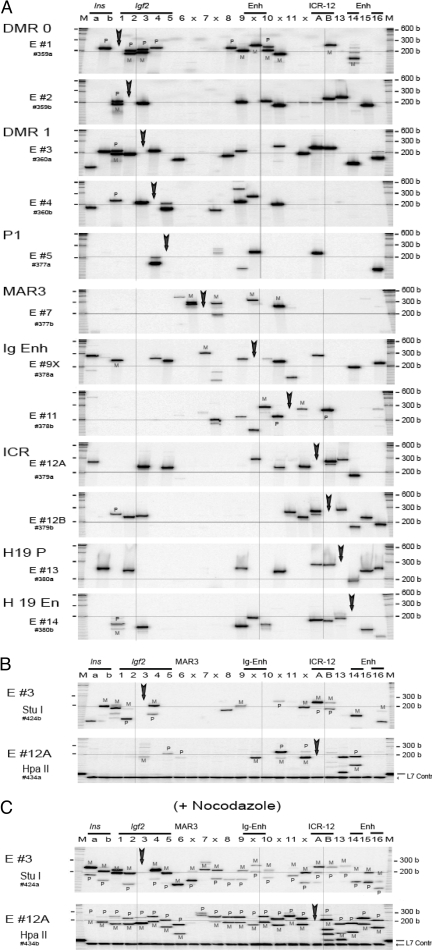
Figure 5.
Local and Long-Range Interaction in ES Cells
A, 3C analysis across 140-kb Igf2/H19 region in ES cells (SF1-G). Details are in Fig. 2A. B, Parental allele-specific pattern of 3C interaction in normal SF1-G between DMR1 RI #3 (E #3, StuI digestion) and the 24 RI sites (top panel) and the interaction between ICR Eco #12A (HpaII digestion) across the 140-kb region (bottom panel). Hot-stop PCR was employed. A control L7 template added before digestion indicates completion of the restriction digest. Note that the intensity of the 3C product in Fig. 5B, E #3 (column 3, lower panel) was weaker than expected. This may be attributable to variation in the handling/loading of this sample. See explanation in supplemental Note N7. C, Parental allele-specific pattern of 3C interaction in mitotic SF1-G. The ES cells were treated with 1 mm nocodazole for 14 h as shown in Fig. 2B. Analysis of allele-specific 3C interaction is detailed in Fig. 4B. A control L7 template indicates complete digestion. M at the top indicates size marker. M, Maternal; P, paternal.

