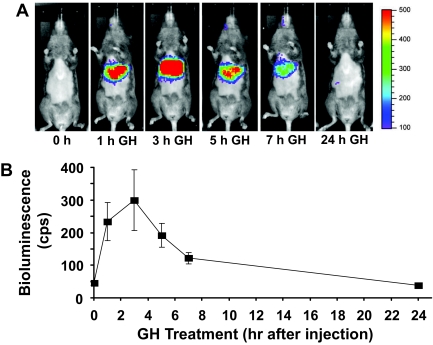
Figure 2.
In Vivo GH Signaling, as Assessed Noninvasively by Bioluminescence Imaging in C3H/HeJ Mice
See Materials and Methods for details of Ad-GHRE-Luc injection into C3H mice. Mice were injected via tail vein with 1 × 10⁹ pfu Ad-GHRE-Luc (n = 7 per condition). A, A representative mouse is shown with imaging at baseline (0 h) and 1, 3, 5, 7, and 24 h after administration of GH (3 μg/g iv) in the morning after 16 h food deprivation. Imaging was obtained with the IVIS system (Xenogen Corp., Alameda, CA) while under isoflurane anesthesia at 37 C with images collected on mice 10 min after ip injection of 2.5 mg luciferin. Image acquisition times were 300 sec, and data acquisition software insured no pixels were saturated during image collection. Liver light emission was measured using Xenogen software. In these images, light emission intensity is represented with pseudocolor scaling of bioluminescent images, which are overlaid on black and white photographs of mice collected at the same time. B, Quantitation of in vivo GH signaling. The light photons were measured in the liver using software provided by the vendor (Xenogen); data are expressed as means with error bars representing the se.

