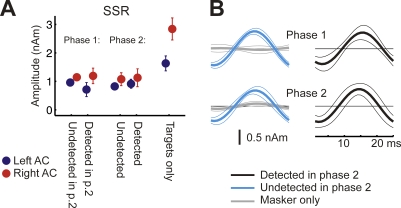
Figure 5. Experiment 2: SSR.
(A) Mean source amplitudes (± 1 s.e.m.) calculated from peak to peak for the SSR.
(B) Grand average source waveforms of the SSR elicited by the amplitude-modulated targets in the presence of the masker. Confidence intervals represent bootstrap based t-intervals. The SSR was evoked irrespective of target-tone awareness and side of attention.

