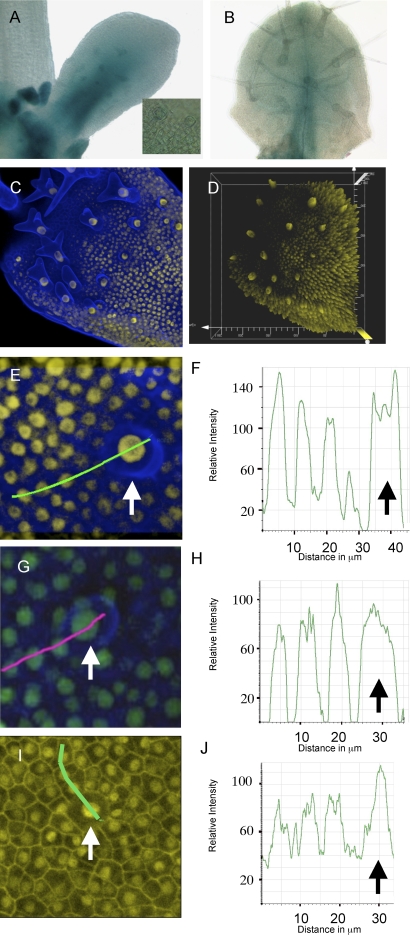
Figure 1. Expression and Localization Analysis of TTG1 in Developing Leaves.
(A) pTTG1:GUS expression in young leaf. Inset depicts a high magnification of an area with two trichomes. Note that the expression strength is similar in all cells, including trichomes.
(B) pTTG1:GUS expression in mature leaf. Expression has ceased.
(C) pTTG1:TTG1–YFP fluorescence in young leaf. Note that in older trichomes fluorescence is still found but that epidermal cells around them have no fluorescence.
(D) Three-dimensional illustration of signal strength in (C). The fluorescence intensity is indicated by the size of the peaks.
(E) pTTG1:TTG1–YFP. The arrow depicts an incipient trichome.
(F) Quantification of the relative fluorescence intensity along the green line in (E). Note that the intensity drops the most in the cell next to the trichome.
(G) pTTG1:GFP-NLS. The arrow depicts an incipient trichome.
(H) Quantification of the relative fluorescence intensity along the pink line in (G).
(I) gl3 pTTG1:YFP. The arrow depicts an incipient trichome.
(J) Quantification of the relative fluorescence intensity along the green line in (I).
Yellow, YFP-specific fluorescence; blue, cell wall stained with propidium iodide (false colored).

