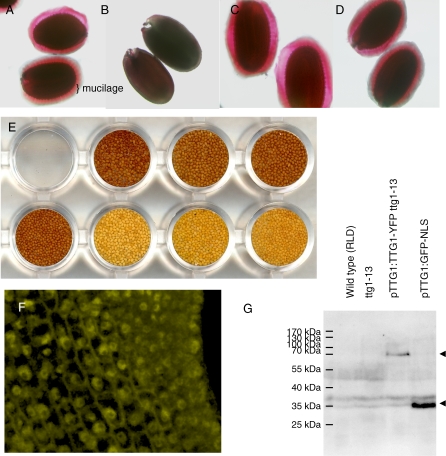
Figure 2. Phenotypic Description of Mutants and Transgenic Lines and Localization of TTG–YFP Fusion Protein.
(A–D) Seed coat mucilage stained with ruthenium red. This staining visualizes the mucilage coat as a diffusely stained zone around the seed indicated by a curly bracket. (A) wild-type ecotype RLD. (B) ttg1–13, no mucilage is seen. (C) ttg1–13 pTTG1:TTG1. (D) ttg1–13 pTTG1:TTG-YFP.
(E) Seed coat color. Upper row: ttg1–13 pTTG1:TTG1, ttg1–13 pTTG1:TTG1-YFP line #4, ttg1–13 pTTG1:TTG1–YFP line #1. Lower row from left to right: wild-type ecotype RLD, strong allele ttg1–13, weak allele ttg1–9 and weak allele ttg1–10.
(F) pTTG1:TTG1–YFP fluorescence. Strong fluorescence is found in the nucleus, and moderate fluorescence in the cytoplasm. This is particularly good to see in regions containing undifferentiated cells.
(G) Western blot analysis to test the integrity of the TTG1–YFP and GFP–NLS fusion proteins. The TTG1–YFP fusion protein (70.5 kDa) is detected as a single band at the expected size (upper arrowhead). This band is not seen in the control lane ttg1–13, and no degradation products were found. Also the GFP–NLS fusion (31 kDa) is detected at the expected size (lower arrowhead).

