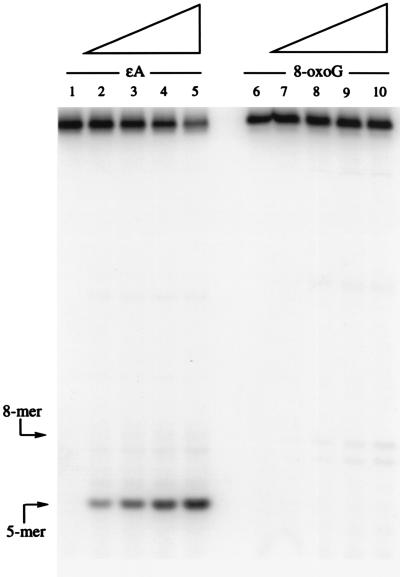
Figure 5.
Autoradiogram of partially purified murine APNG-treated ɛA oligomer (Fig. 1, sequence 2) (Left) and 8-oxoG oligomer (Fig. 1, sequence 5) (Right) after treatment with increasing amounts of the recombinant protein, from 2.5 to 15 ng, shown by the slope of the triangles above. Lanes 1 and 6 are controls with no added protein. The reaction conditions were the same as in Fig. 2 except that HAP1 at 0.5 μg/ml was added to cleave the AP site on the 5′ side. The use of HAP1 alone under the same conditions does not cause any cleavage of either oligomer (data not shown). The positions of the size markers are indicated by arrows.

