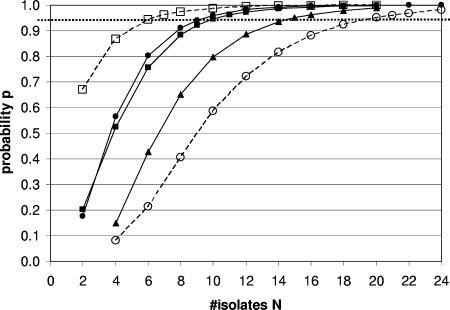
FIG. 1.
Probability p of finding all strains of a species present in sample when N isolates per sample are characterized. Squares indicate L. monocytogenes, circles indicate S. uberis, and triangles indicate K. pneumoniae. Filled symbols and solid lines indicate fecal samples. Open symbols and dashed lines indicate soil samples. Cut-offs with the horizontal dotted line that marks the 95% probability p yield the numbers of required isolates (N) (e.g., N is about 6 for L. monocytogenes in soil □).

