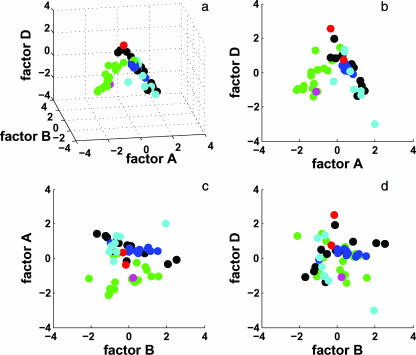
FIG. 5.
Results from PCA. Samples are colored to match the geographic color codes used in Fig. 3. (a) The relationship between environmental factors A, B, and D shows that the samples form a “tent” or V shape around an apex between factors A and D. (b) Factor D relative to factor A shows the grouping of Yellowstone and Kamchatka samples with pure cultures and Great Basin (Nevada and California) samples with the single Thailand sample. (c and d) There is no pattern in the relationship between factor A or D and factor B, but samples from common geographic origins tend to cluster together.

