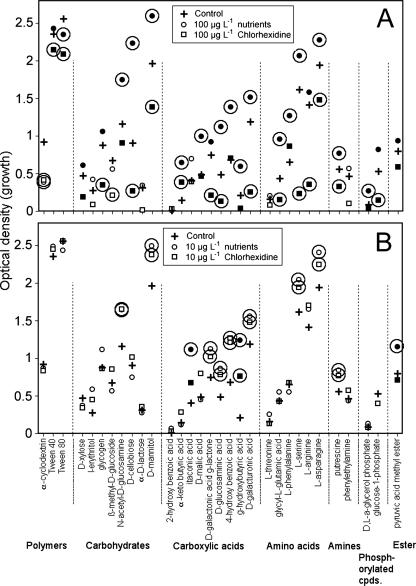
FIG. 3.
(A and B) Differential displays of the carbon utilization assays of control biofilms and those growing with 10 μg liter−1 (B) and 100 μg liter−1 (A) chlorhexidine treatments and their respective nutrient controls. The circled data points are significantly different from their respective control values (P ≤ 0.05); those in solid black are significantly different from their respective treatments, either nutrient or chlorhexidine (P < 0.05).

