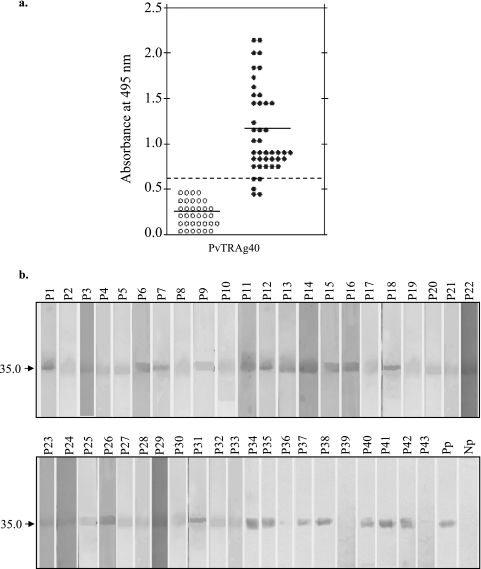
FIG. 4.
Antibody responses to PvTRAg40 in P. vivax patients. (a) ELISA was performed with 43 sera from P. vivax-exposed patients and 34 sera from malaria-naïve individuals (both at a 1:400 dilution), using the HPLC-purified recombinant protein derived from exon 2 of PvTRAg40. The solid horizontal lines indicate the mean OD values, while the broken horizontal line indicates the cutoff value. (b) Western blot analysis of the above-mentioned HPLC-purified recombinant protein and serum samples. Purified protein was resolved by SDS-PAGE and then transferred to a nitrocellulose membrane. The nitrocellulose filter for each lane was cut and incubated with individual P. vivax-exposed and control sera (1:100 dilution). Pp, blot developed with pooled patient sera; Np, pooled malaria-naïve control sera. The arrow indicates the position of the PvTRAg40 band.

