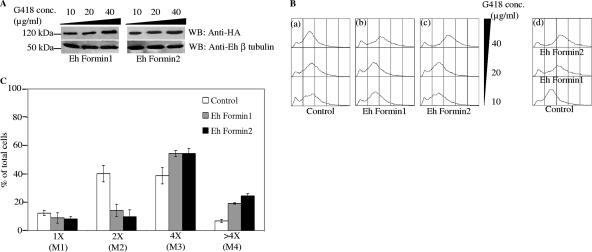
FIG. 5.
Increased expression of Ehformin-1 and -2 leads to increases in the DNA contents of E. histolytica cells. (A) Lysates from 48-h-grown cells of Ehformin-1 and -2 transformants maintained at 10-, 20-, and 40-μg/ml concentrations of G418 were separated by SDS-PAGE, and Western blots (WB) of these lysates were hybridized with an anti-HA antibody to detect the expression of HA-tagged Ehformin-1 and -2 in the respective transformants maintained at different G418 concentrations. Similar blots were hybridized with a polyclonal anti-E. histolytica β-tubulin antibody as a loading control. (B) Forty-eight-hour-grown cells of Ehformin-1, Ehformin-2, and control transformants maintained at 10-, 20-, and 40-μg/ml concentrations of G418 were stained with propidium iodide to analyze the average DNA content. (a to c) Flow cytometric profiles of DNA contents of control (a), Ehformin-1 (b), and Ehformin-2 (c) transformants at increasing concentrations of G418 are shown as overlay diagrams. (d) Histogram overlay shows DNA contents of control, Ehformin-1, and Ehformin-2 transformants maintained at 40 μg/ml of G418. (C) The histogram plots obtained from the flow cytometric analyses of propidium iodide-stained Ehformin-1, Ehformin-2, and control transformants maintained at 40 μg/ml G418 were demarcated into electronic gates M1, M2, M3, and M4, corresponding to cells with 1×, 2×, 4×, and >4× DNA contents, respectively. Bars show percentages of cells in each electronic gate. Error bars, standard deviations (n = 3).

