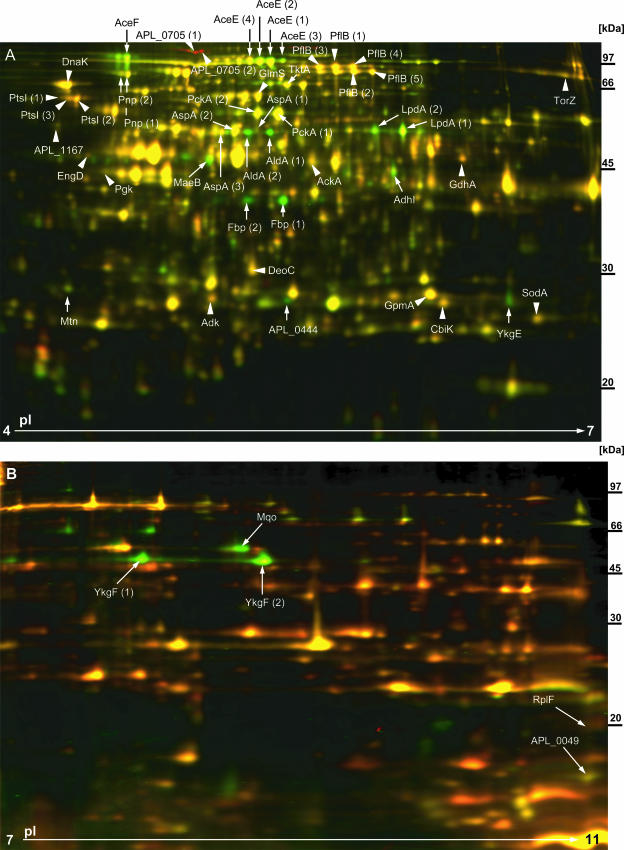
FIG. 2.
2D DIGE analysis. The A. pleuropneumoniae wt (shown here labeled with Cy5 [red]) and A. pleuropneumoniae ΔarcA (shown here labeled with Cy3 [green]) proteins were precipitated directly from whole-cell lysates and separated by using Immobiline DryStrips with pI gradients of 4 to 7 (A) or 7 to 11 (B). The A. pleuropneumoniae wt and A. pleuropneumoniae ΔarcA mutant were grown anaerobically in four independent cultures (each). By using three fluorescent dyes, Cy2 (blue [internal standard]), Cy3 (green [either wt or ΔarcA]) and Cy5 (red [either wt or ΔarcA]), on each gel, an internal standard and a protein preparation of the A. pleuropneumoniae wt and A. pleuropneumoniae ΔarcA mutant were separated simultaneously. Fluorescence was detected using a Typhoon Trio fluorescence scanner. Quantitative and statistical analyses of differences in protein expression levels were performed with DeCyder 2D 6.5 software. Each gel shown here represents one out of four gels that were run and analyzed. Arrowheads highlight protein spots that were significantly (P ≤ 0.05) upregulated in the presence of ArcA. Arrows indicate protein spots that were significantly (P ≤ 0.05) downregulated in the presence of ArcA. Protein spots of interest were excised from preparative gels, trypsinized and, after recovery of peptides from the gel, analyzed by MS.

