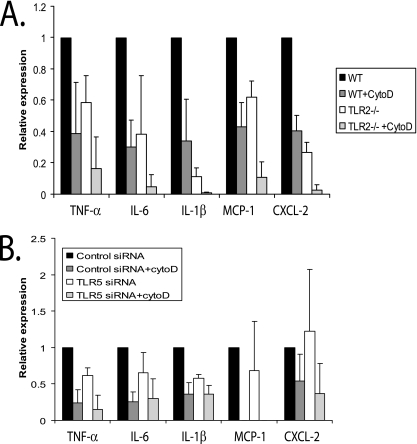
FIG. 7.
Effects of inhibition of phagocytosis by cytochalasin D on inflammatory signaling via TLR2 and TLR5. (A) BMDM from either wild-type (WT) control or TLR2−/− mice were plated in six-well plates. Cytochalasin D (1 μM) was added to the macrophages 1 h before incubation with B. burgdorferi to block uptake of the bacteria into BMDM. The BMDM were stimulated with B. burgdorferi for 24 h, and cells were harvested for RNA isolation. Transcriptional expression of TNF-α, IL-6, IL-1β, MCP-1, and CXCL-2 was measured by qRT-PCR, as described in Materials and Methods. The expression of target genes was normalized to that of β-actin. Expression with wild-type cells infected with B. burgdorferi was arbitrarily set to 1 for all the experiments, and the other values are shown relative to that expression level. The experiments were performed three times in duplicate, and the averages of the experiments are shown. The error bars represent standard deviations. The P values for all tested cytokines and chemokines, comparing B. burgdorferi-infected wild-type and TLR2−/− BMDM, were ≤0.05. Comparisons between B. burgdorferi-infected wild-type cells treated or not with cytochalasin D and between B. burgdorferi-infected wild-type cells and TLR2−/− cells treated with cytochalasin D were also all statistically significant (P ≤ 0.05). (B) Raw 264.7 cells were transfected with either control or TLR5 siRNAs. After 24 h, cytochalasin D (1 μΜ) was added to the macrophages 1 h before incubation with B. burgdorferi to block uptake of the bacteria into the Raw 264.7 cells. The cells were stimulated with B. burgdorferi for 24 h and harvested for RNA isolation. Transcriptional expression of TNF-α, IL-6, IL-1β, MCP-1, and CXCL-2 was measured by qRT-PCR, as described in Materials and Methods. The expression of target genes was normalized to that of β-actin. Expression with control siRNA-transfected cells infected with B. burgdorferi was arbitrarily set to 1 for all the experiments, and the other values are shown relative to that expression level. The experiments were performed three times in duplicate, and the averages of the experiments are shown. The error bars represent standard deviations.

