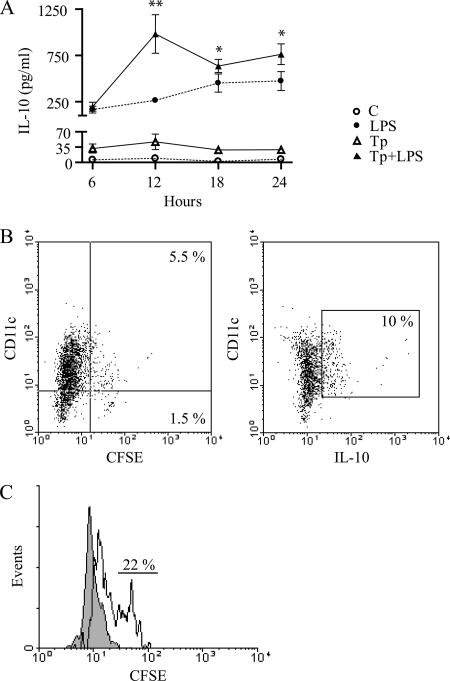
FIG. 6.
Kinetics of IL-10 secretion by DC. Secretion occurs early and is not correlated with DC infection. (A) Cells (106/ml) were cultured in medium with or without LPS (10 μg/ml) and/or Tp at a Tp/cell ratio of 4/1 for 6, 12, 18, or 24 h. The concentrations of IL-10 in culture supernatants were measured by ELISA. The data show the means of three independent experiments ± the SEM. *, P < 0.05; **, P < 0.01 (compared to LPS treatment values). (B) Cells were also cocultured with Tp labeled with CFSE (4/1, Tp/DC) for 12 h. The cells were then washed, and the percentage of infection and IL-10 production were determined by flow cytometry. (C) Percentages of infected DC that were actively producing IL-10. The gray histogram represents the FACS profile of control cells. The open histogram represents the FACS profile of Tp-treated cells gated in the IL-10 positive quadrant. Quadrant gates were set on appropriate controls or isotype-matched controls. The data are representative of two independent experiments.

