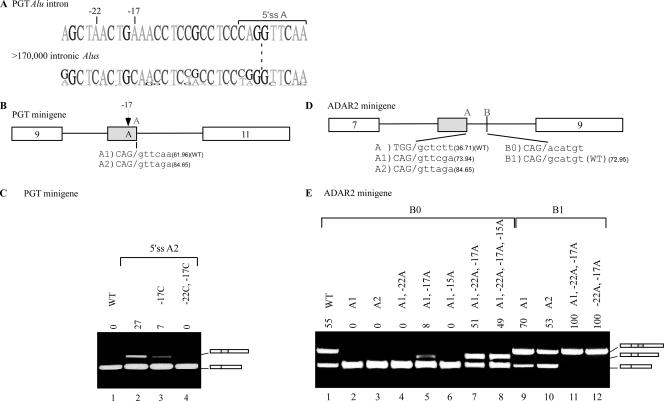
FIG. 5.
Selection of 5′ss A in ADAR2 Alu exon. (A) The upper sequence shows the last 26 nt and first 6 nt of the exon-intron junction of 5′ss A of the PGT Alu exon. The lower sequence is the sequence in the corresponding region of the alignment of ∼177,000 introns in the intronic data set. Positions −22 and −17 and a putative ESR are indicated above the exon sequence. (B) Diagram of PGT minigene. 5′ss A, selected for this experiment, is marked above the box. wt and mutated 5′ss are shown in the lower part, marked A1 and A2; Senapathy scores are given in parentheses. Position −17A upstream of 5′ss A is marked above the box. (C) Analysis of in vivo splicing assay as described in the legends of previous figures. Lane 1, splicing products of wt PGT gene; lanes 2 to 4, splicing products of exon 10 mutants containing an A2 site with the indicated mutations. (D) Diagram of ADAR2 minigene. The two alternative 5′ss positions (A and B) selected in this experiment are marked above the box. wt and mutated 5′ss, marked as A to A2, B0, and B1, are shown in the lower part; Senapathy scores are given in parentheses. (E) In vivo splicing assay as described for panel C. Lane 1, splicing products of wt ADAR2 gene; lanes 2 to 8, splicing products of exon 8 after mutation to eliminate 5′ss B (indicated as 5′ss B0), together with the indicated mutations; lanes 9 to 12, splicing products of exon 8 mutants containing 5′ss B1, together with the indicated mutations.

