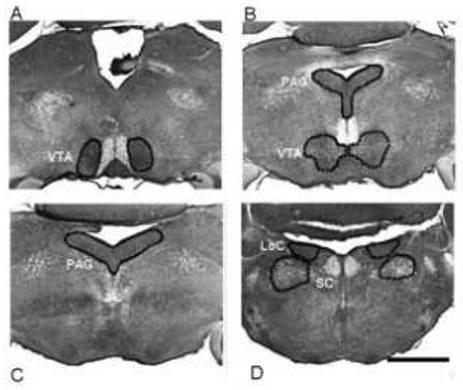
Figure 3.

Photomicrograph of four catecholaminergic brainstem regions. Panel A shows rostral ventral tegmental area (VTA). Panel B shows the locus coeruleus (LoC) with the sub coeruleus (SC). Panel C shows the rostral region of the periaqueductal gray (PAG) and the caudal VTA. Panel D shows the caudal region of the PAG. Scale bar = 1mm
