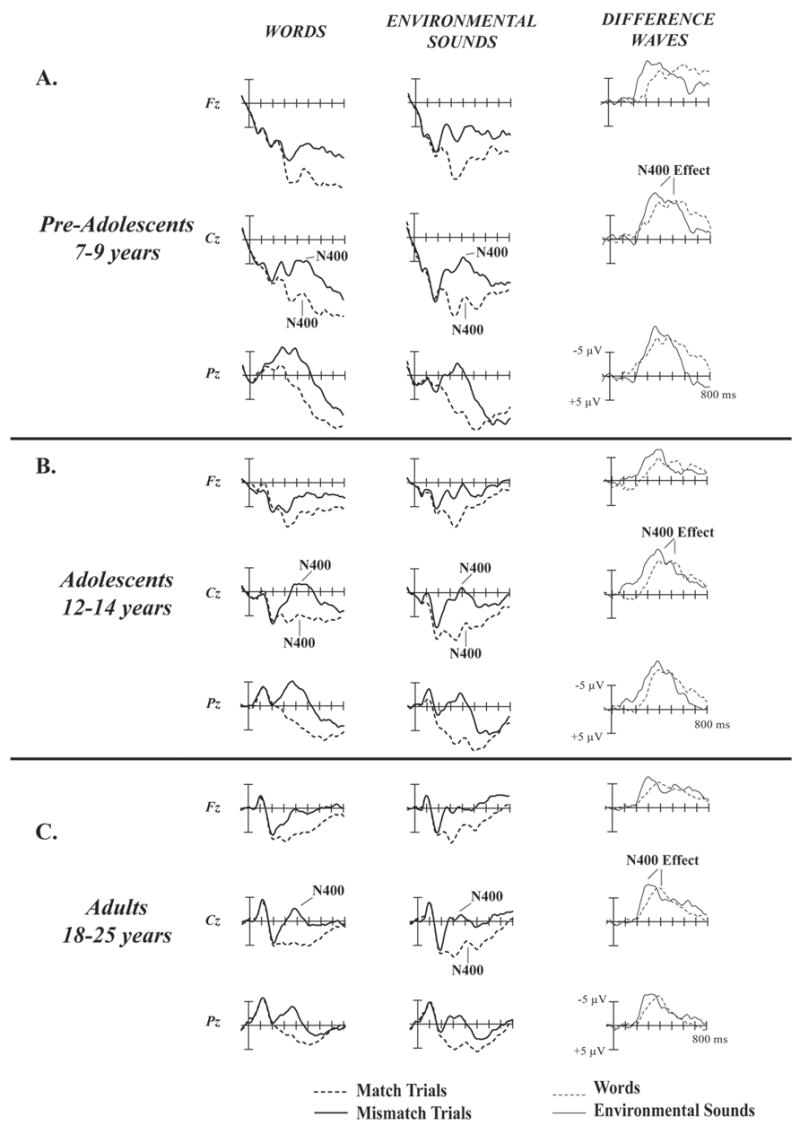
Figure 1.

Matching and Mismatching Word (left column) and Environmental Sound (middle column) ERPs and Difference Waves (right column).
A. Pre-Adolescents. The N400 component is clearly visible in the matching and mismatching ERPs in response to words and environmental sounds in the 300 – 500 ms range. The N400 effect is a difference between the matching and mismatching ERPs in response to words and environmental sounds in the 300 – 500 ms range. The N400 effect appears as a negative peak in the mismatch-ERP minus match-ERP difference waves.
B. Adolescents. The N400 component is clearly visible in the matching and mismatching ERPs in response to environmental sounds and mismatching words, though diminished in response to matching word trials. The N400 effect is clearly visible as a negative peak in the difference waves.
C. Adults. The N400 component is clearly visible in the matching and mismatching ERPs in response to environmental sounds and mismatching ERPs to words, but barely visible in response to matching word trials. The N400 effect is clearly visible as a negative peak in the difference waves.
