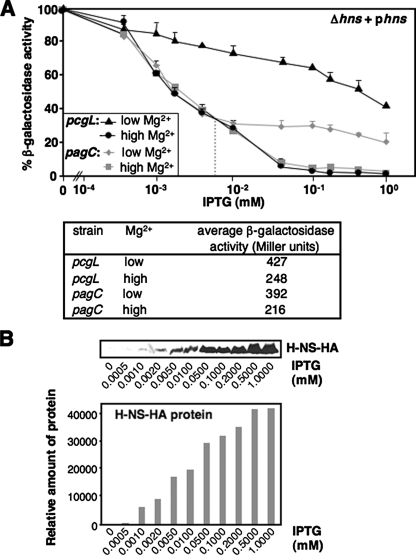
FIGURE 5.
H-NS controls PhoP-activated transcription and establishes response of the PhoP/PhoQ system to Mg2+. A, pcgL-lacZ (black lines) and pagC-lacZ (gray lines) transcriptional fusions expressed by bacteria was determined in hns mutant (YS11744 and YS11780, respectively) strains harboring pYS1118 grown for 4 h in N medium, pH 7.4, containing Mg2+ concentrations of 0.01 mm (or low, triangle for pcgL and diamond for pagC) or 10 mm (or high, circle for pcgL and square for pagC), and supplemented with different concentrations (0, 0.0005, 0.001, 0.002, 0.005, 0.01, 0.05, 0.1, 0.2, 0.5, and 1 mm) of IPTG. Percentage of β-galactosidase activity = (β-galactosidase activity in y mm IPTG ÷ β-galactosidase activity in 0 mm IPTG) × 100. “y mm” means a given IPTG concentration tested. The table in the lower panel shows β-galactosidase activity from each strain grown in either low and high Mg2+ without supplementing IPTG. The gray dashed vertical line divides stages I and II in pagC repression by low and high concentrations of H-NS. B, immunoblot analysis of cell extracts prepared from the hns mutant (YS11708) harboring pYS1119. Bacteria were grown for 4 h in N medium, pH 7.4, containing 0.01 mm Mg2+ and supplemented with different IPTG concentrations used in A. Protein samples were separated in SDS-PAGE (15% acrylamide). Monoclonal anti-HA antibodies (Sigma) were used for HA-tagged H-NS. Relative protein amount (shown in the lower panel) was measured by using software Quantity One and calculated by using the density from 0 mm IPTG sample (=2,992) as the baseline.

