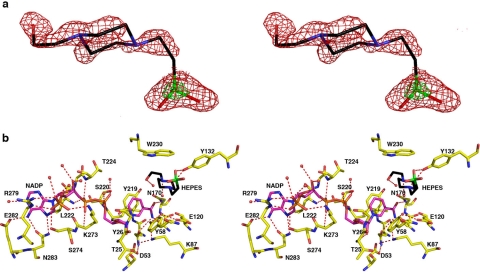
FIGURE 3.
AKR1D1·NADP+·HEPES complex. a, shown is the difference electron density map of HEPES bound in the active site of AKR1D1 prior to the inclusion of HEPES in the refinement (contoured at 2.2σ; red). The electron-rich sulfur atom of HEPES is indicated by its stronger electron density contoured at 6.7σ (green). b, hydrogen bond interactions in the AKR1D1·NADP+·HEPES complex are indicated by red dashed lines. Atoms are color-coded as described for Fig. 2a except that protein carbon atoms are yellow, HEPES carbon atoms are black, and its sulfur atom is green.

