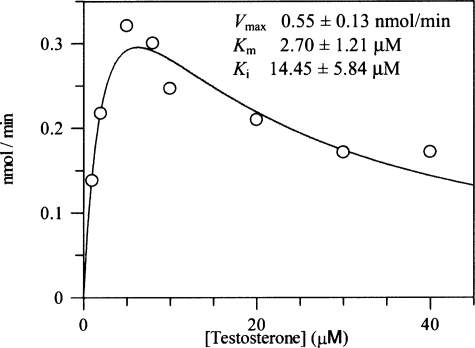
FIGURE 6.
Substrate inhibition of AKR1D1 by testosterone. A velocity versus substrate plot for AKR1D1 shows substrate inhibition using testosterone. Assays contained 0.078 μm enzyme, 1-40 μm testosterone, 15 μm NADPH, and 4% acetonitrile in 100 mm potassium phosphate buffer (pH 6.0) in a final volume of 1 ml. Reactions were monitored fluorometrically using an excitation wavelength of 340 nm (slit width of 5 nm) and an emission wavelength of 450 nm (slit width of 10 nm) at 37 °C. Kinetic analysis of initial velocities obtained was performed using the Henri-Michaelis-Menten equation for uncompetitive substrate inhibition, v = (Vmax× [S])/(Km + [S] + [S]2/Ki), and fit using the program GraFit. The iterative fits provided estimates of Vmax, Km, and Ki and associated S.E. values.

