
Fig. 1.
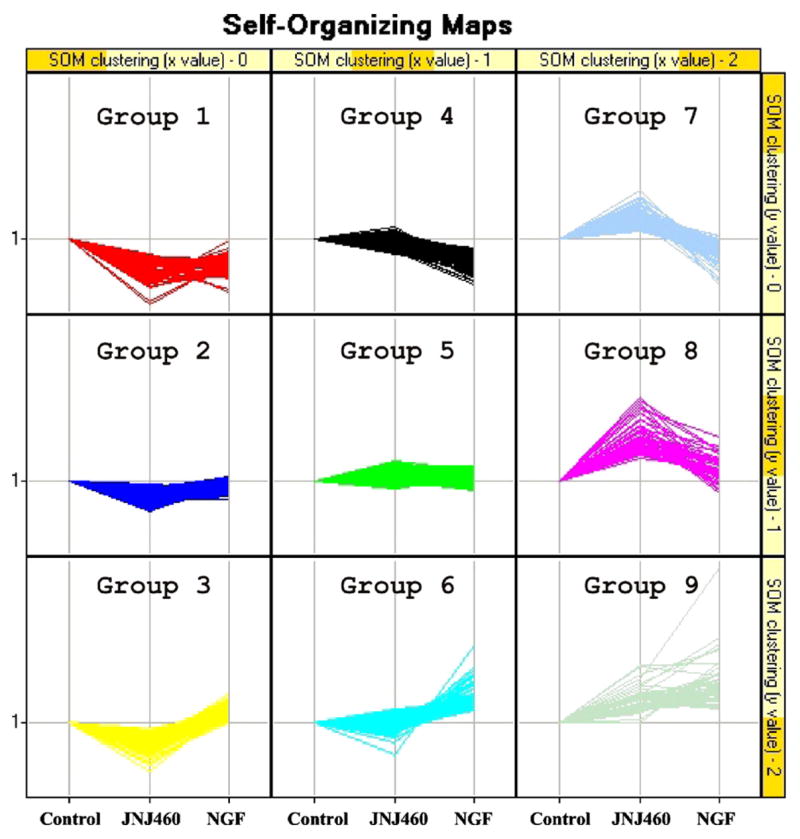
Proteomic clustering by self-organizing map. SOM analysis of proteins identified in iTRAQ experiments using Spotfire software produced a 3 × 3 cluster. The control is shown as the baseline, to which JNJ460 and NGF treatments are compared to. Groups 3 and 6 include proteins that are specifically upregulated upon NGF treatment; whereas groups 7 and 8 include proteins upregulated with JNJ460 treatment. Proteins showing similar trends between the two treatments are clustered in groups 1 and 9.