
Fig. 3.
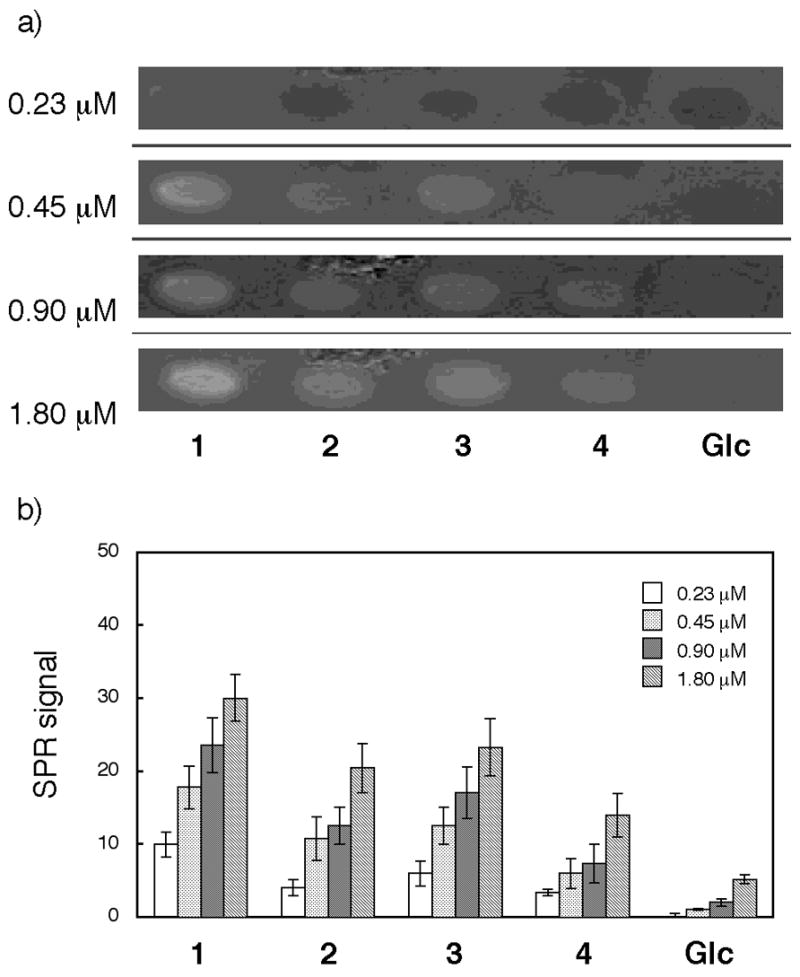
Binding study with rh-vWf-A1. a) SPR difference imaging on the chip immobilized with compounds 1, 2, 3, 4, and Glc α(1–6)Glc-mono (Glc). Measurements were carried out with analyte in the range between 0.23 μM and 1.80 μM. b) Bar graph profiles of different concentrations. The error bars represent +/− SEM.