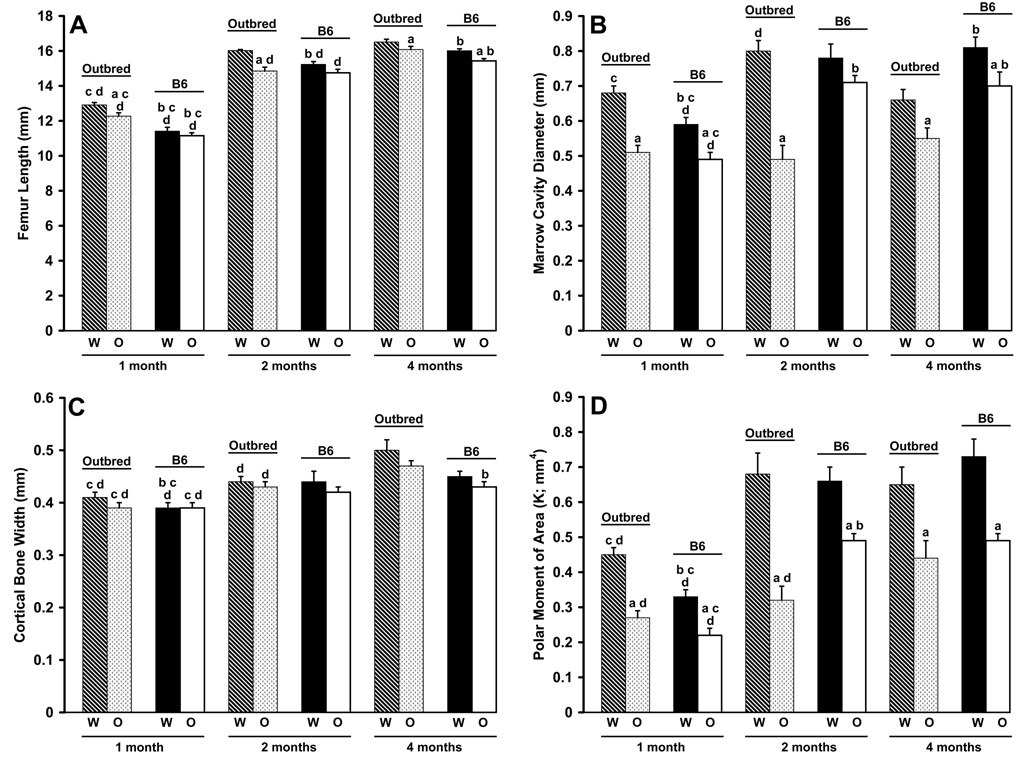
Figure 4.
Femoral geometry of B6 and outbred Wt, oim/+ and oim/oim mice at 1, 2 and 4 months of age. A) Femur length exhibited strain differences in Wt (all ages) and oim/oim femurs (1 and 4 months). Outbred Wt femurs were longer than oim/oim femurs (all ages); B6 Wt femurs were longer than oim/oim femurs (4 months). B) Marrow cavity diameter (MCD) showed strain differences in Wt animals (1 and 4 months) and in oim/oim animals (2 and 4 months). Wt femurs of both strains had larger MCDs than oim/oim femurs (1 and 4 months); outbred Wt femurs were also larger at 2 months. C) Cortical bone width (CBW) had strain differences in Wt femurs (1 month) and in oim/oim femurs (4 months). D) Polar moment of area (K) showed strain differences in Wt femurs (1 month) and in oim/oim femurs (2 months). Wt femurs had a larger K than oim/oim femurs in both strains at all ages. ap≤0.05 as compared to Wt femurs of the same strain and age; bp≤0.05 as compared to outbred femurs of the same genotype and age; cp≤0.05 as compared to 2 month femurs of the same genotype and strain; dp≤0.05 as compared to 4 month femurs of the same genotype and strain. [per age class: Wt, n=8–18; oim/+, n=8–15; oim/oim, n=8–14]

