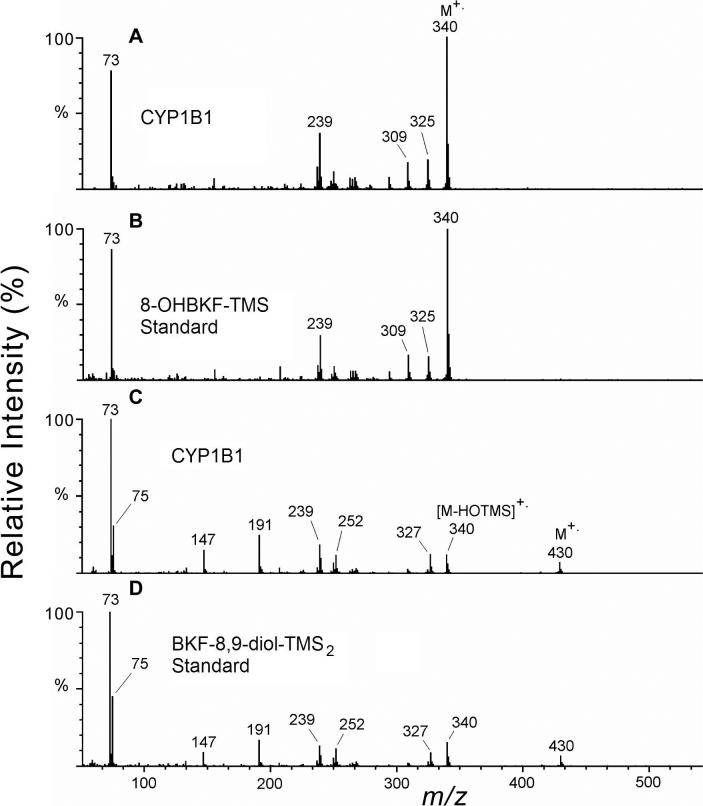
Fig. 8.
Mass spectra of the TMS derivatives of BKF metabolites. The electron ionization mass spectrum recorded at 38.0 min from the CYP1B1 microsomal extract (A) is shown in comparison with that of the standard 8-OHBKF-TMS derivative (B), and the mass spectrum recorded at retention time 42.9 min from analysis of the CYP1B1 microsomal extract (C) is shown in comparison with that of the standard BKF-8,9-diol-TMS2 derivative (D).

