
Fig. 3.
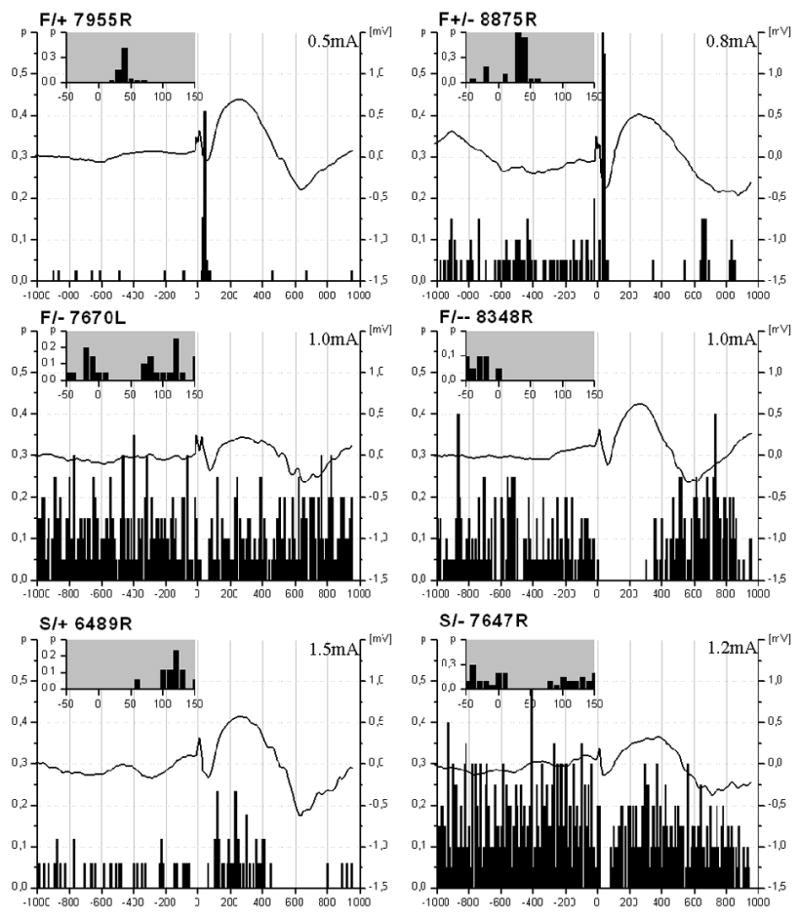
Diversity of changes in neuronal activity in F-, and S-cells following PFC stimulation. Both F and S cells showed inhibition or facilitation as a response for the PFC stimuli, though among F cells, a higher degree of diversity was found. Inhibitory responses were more frequent in neurons with higher background activity while facilitation occurred in those cases when the neurons showed relatively low discharge rate. Black curves show averaged cortical evoked potentials recorded from the M1/M2 cortical areas. Insets of the peri-event time histograms (PETHs) zoom in on the first 150 ms of the evoked responses.