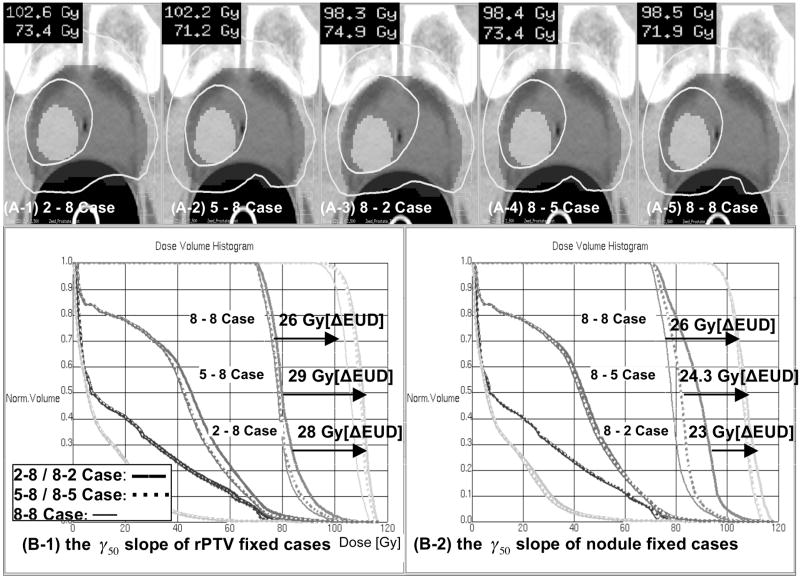
Figure 4.
Isodose distributions and DVHs for a number of γ50 combinations. The isodose distributions were constructed for γ50 values of 2, 5, and 8. In panel (A), the γ50 value of the rPTV remained fixed and that of the nodule was varied. In panel (B), the γ50 value of the rPTV was varied and that of the nodule remained fixed.

