
Figure 2.
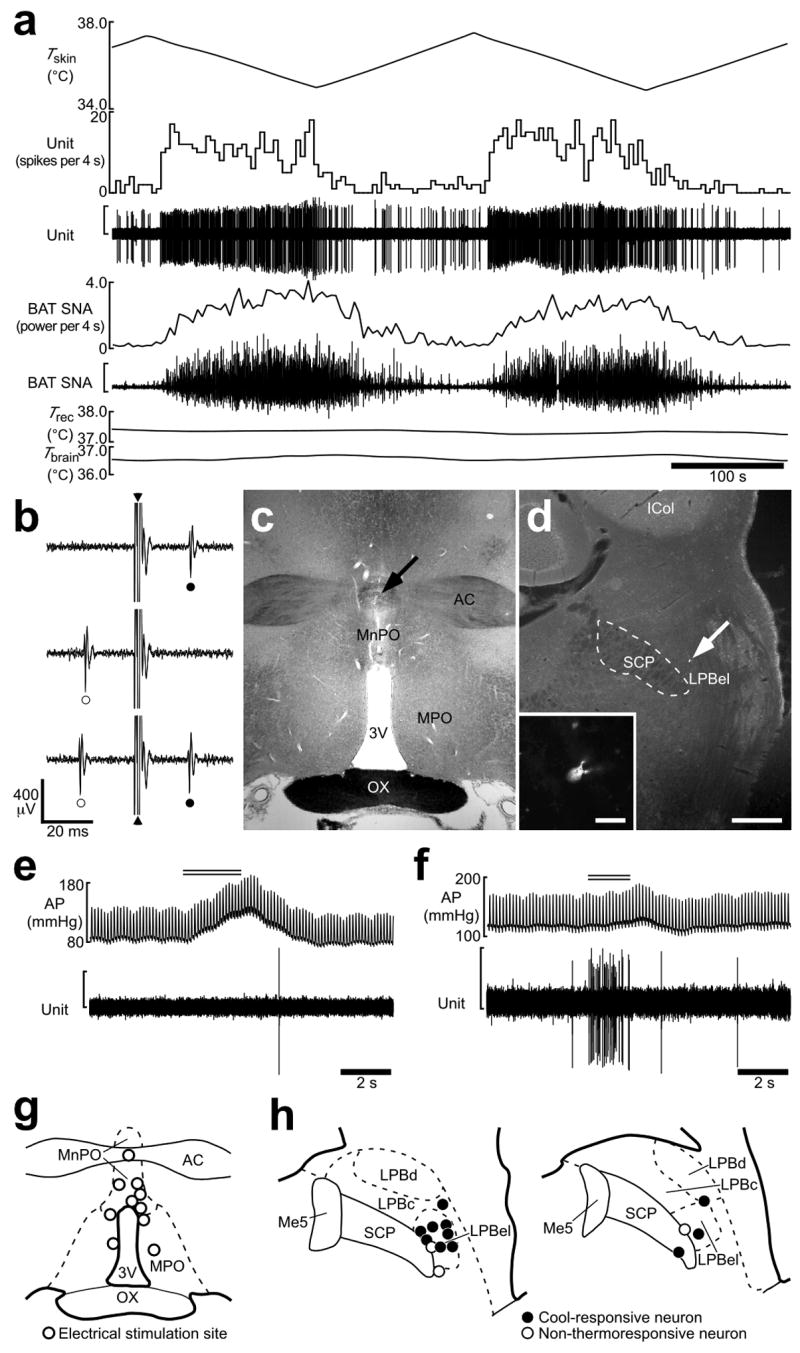
Skin cooling-evoked response of single LPB neurons antidromically activated from the POA. (a) In vivo extracellular unit recording of the action potentials of an LPB neuron (unit) and changes in BAT SNA, rectal temperature (Trec) and brain temperature (Tbrain) in response to trunk skin cooling (Tskin). The vertical scale bars for the unit and BAT SNA traces represent 300 μV and 100 μV, respectively. Note that Trec and Tbrain do not change substantially during skin cooling and rewarming. (b) Collision test for the LPB neuron shown in a. Single pulse stimulation in the POA (triangle) evoked a constant-onset latency (20 ms) response in this neuron (filled circle, top trace). POA stimulation at 19 ms after a spontaneous action potential (open circle) failed to evoke a response of this neuron (middle trace). POA stimulation at 21 ms after a spontaneous action potential evoked a constant-onset latency response of this neuron (bottom trace). All traces are superpositions of 3 stimulation trials. (c) The site of electrical stimulation for the collision tests in b. The site is identified by a small scar at the site of electrical stimulation (arrow). (d) Juxtacellular labeling allows visualization of the LPB neuron (arrow) from a. Inset, a magnified picture of this neuron. Scale bars, 0.5 mm (c,d), 30 μm (inset in d). (e,f) Effect of tail pinch on firing activities of a cool-responsive neuron (e; the same neuron shown in a) and a non-thermoresponsive neuron (f). Double horizontal lines indicate the period of tail pinch. Note that tail pinch evoked a pressor response in both cases. The vertical scale bars for the unit traces in e and f represent 200 μV. (g) Sites of electrical stimulation in the POA. (h) Locations of LPB neurons that were juxtacellularly labeled after unit recording. Neurons antidromically activated with electrical stimulation in the POA are categorized in terms of their responsiveness to skin cooling. Me5, mesencephalic trigeminal nucleus.