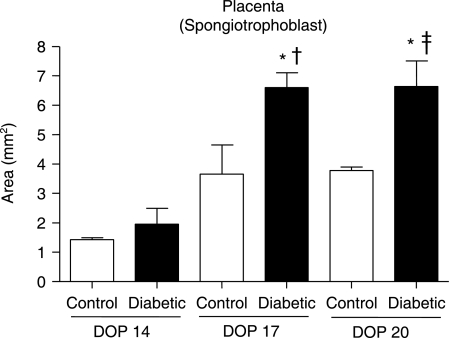
Fig. 1.
Morphometric analysis of the spongiotrophoblast layer of placentas obtained from control and diabetic rats on days of pregnancy (DOP) 14, 17, and 20. Spongiotrophoblast area (mm2) of placentas from control (white bars) and diabetic (black bars) with 14th, 17th and 20th DOP. The bars represent means ± SEM of each group. *P < 0.05 vs. diabetic group on DOP 14; †P < 0.05 vs. control group on DOP 17; ‡P < 0.05 vs. control group on DOP 20.

