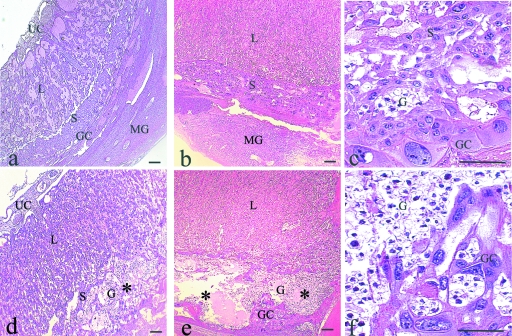
Fig. 2.
Morphology of placentas with H&E staining: Placentas from control rats (a–c). Day 14 of pregnancy (a): overall view of the labyrinth (L) region, spongiotrophoblast (S) layer, and trophoblast giant cell (GC) compartment in contact with the metrial gland; (b) Day 20: Note the growth of the L and S regions; (c) high magnification of (b) showing the S. Placentas from diabetic rats (d–f) Day 14 (d): Note the presence of glycogen-rich (G) cells in the S layer (*); Day 20 (e): The S layer is expanded and shows vacuolization (*) and spatial disorganization (*); (f) High magnification of (e) showing a decrease in the number of S cells, an increase in the number of G cells and disorganization of the GC compartment. UC, umbilical cord; MG, metrial gland. Scale bar = 100 µm.

