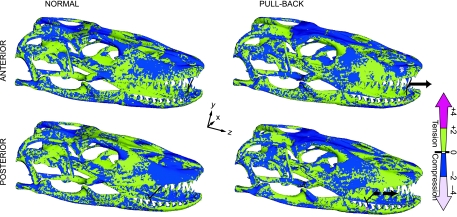
Fig. 4.
Minimum principal stress distribution for heterogeneous models of symmetrical distal/mesial, normal/pull-back bite. Colour scale indicates compressive and tensile stress distributions. Peak stresses have been scaled out. Note that distal and mesial pull-back load cases receive higher compressive stress in the dorsal cranium, posterior maxilla, anterior quadrate and pterygoid-epipterygoid joint than in distal and mesial normal bites.

