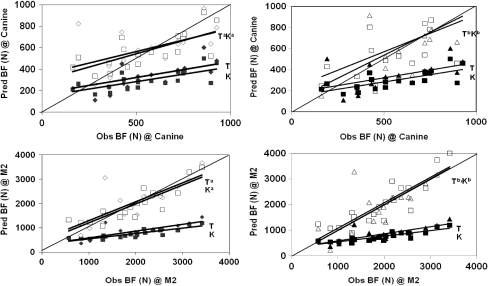
Fig. 4.
Predicted vs. observed bite force (BF) at the canine (top) and M2 (bottom) tooth, where solid dots represent unadjusted predicted BF by the Thomason (1991) model (T) or by the Kiltie (1984) model (K), and hollow points represent the equivalent predictions made by the adjusted models, where (Ta) represents models adjusted with method 1 (Eqs 3–6) and (Tb) represents models adjusted with method 2 (Eqs 7–10).

