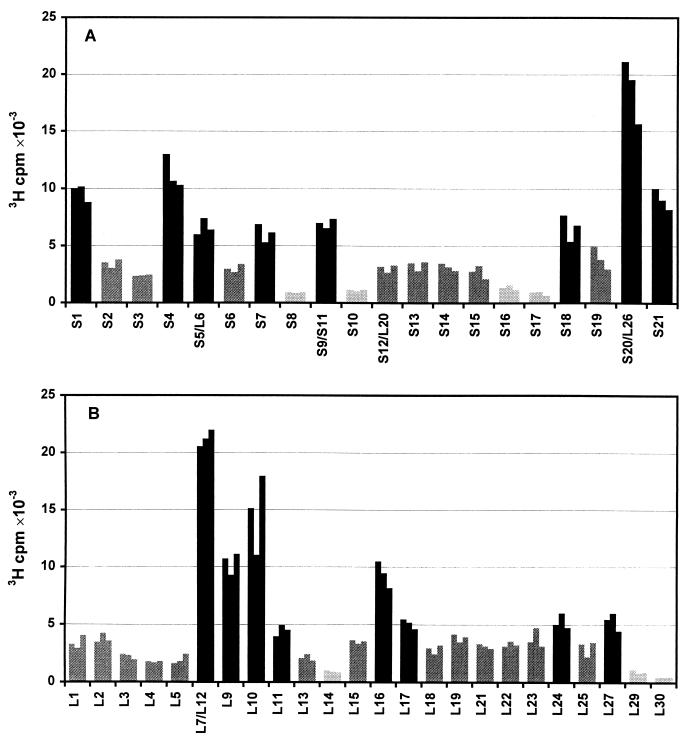
Figure 3.
Labeling of nondissociated 70S ribosomes at 10 mM Mg2+ (buffer C). Tritium radioactivity of each protein is shown by three bars representing three independent experiments. Black bars, the well-exposed proteins; grey bars, the poorly exposed proteins; dark gray bars, the moderately exposed proteins. (A) Proteins of the 30S subunit; (B) proteins of the 50S subunit.

