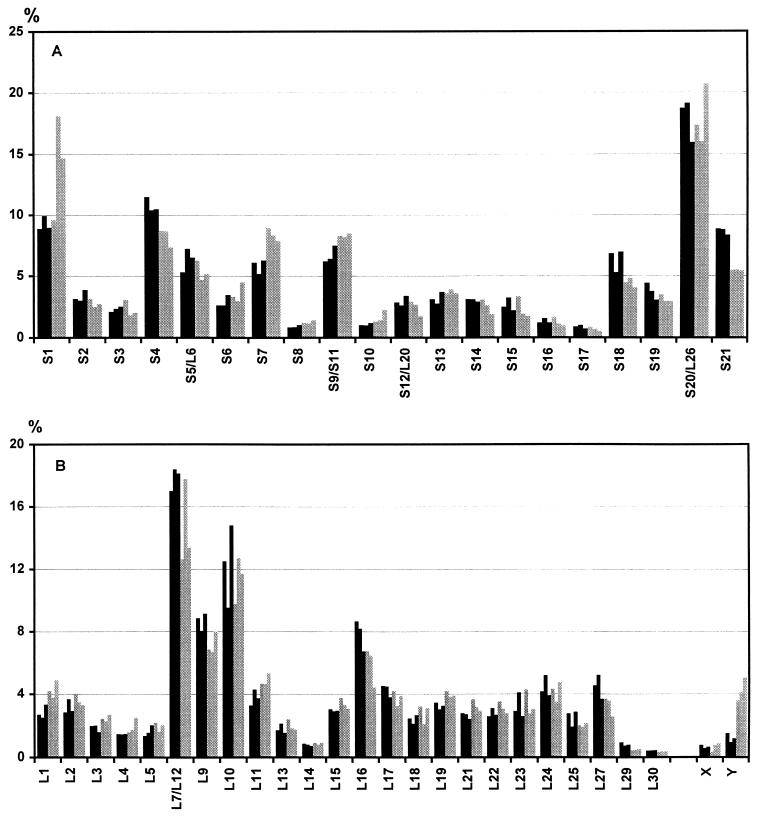
Figure 4.
Labeling of the equimolar mixture of ribosomal subunits at 1 mM Mg2+ (buffer D). Radioactivity of each protein is shown by bars in percents of the total radioactivity found in all the protein spots on the gel. Gray bars, proteins labeled within subunits of dissociated ribosomes; black bars, proteins labeled within the nondissociated ribosomes at 10 mM Mg2+. Each bar represents an independent experiment. (A) Proteins of the 30S subunit, and (B) proteins of the 50S subunit.

