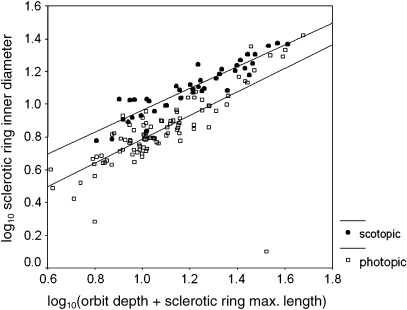
Fig. 3.
Scatter plot of log10 inner diameter of the sclerotic ring (bony correlate of corneal diameter) on the y-axis and log10(orbit diameter + sclerotic ring max. length) on the x-axis (a bony correlate of axial length of the eye). ancova analysis shows significant elevational differences between scotopic and photopic RMA regression lines.

