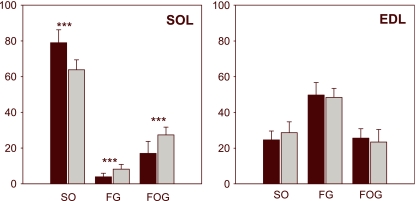
Fig. 4.
Changes in fibre type composition in soleus (SOL) and in extensor digitorum longus (EDL) muscles of animals submitted to hypoxemic hypoxia (grey bars) in comparison to controls (black bars). Hairlines indicate the standard deviation of the mean. Significant differences (control versus hypoxemic) are indicated: ***P < 0.001.

