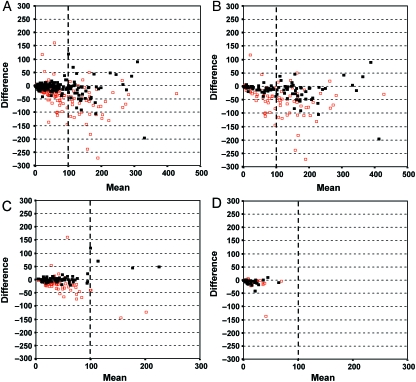
Fig. 4.
Superimposed Bland-Altman graphs comparing manual microscopic and semi-automated methods (in black), and first and second manual microscopic readings (in red) (A). The differences between the semi-automated and the manual methods appear closer to zero than the differences between manual microscopic readings for membrane (B), cytoplasmic (C) and nuclear (D) patterns of staining.

