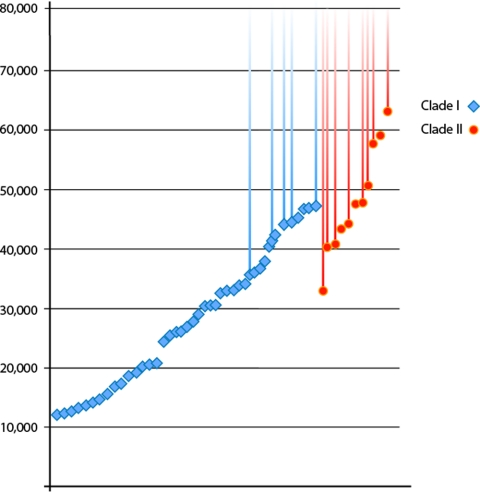
Fig. 4.
Temporal distribution of 43 14C dated clade I and 11 clade II mammoths. For a number of individuals (5 clade I and 8 clade II, indicated by the extended timelines) finite dates could not be calculated; thus, the reported dates are only indicative of minimum bounds on the samples' ages. In this context, some aspects of the figure may be misleading—for example, the apparent absence of clade I mammoths between ≈50,000 and 60,000 14C years ago. The apparently “older” minimum on the infinite dates of most of the hair (this study) as compared with bone samples (1) may reflect a superiority in hair over bone material with regard to long-term carbon preservation in the samples.

