
Figure 8. Stat3, ERK1 and ERK2 phosphorylation in myeloma cells stimulated with IL-6, IFN-α or IGF-1.
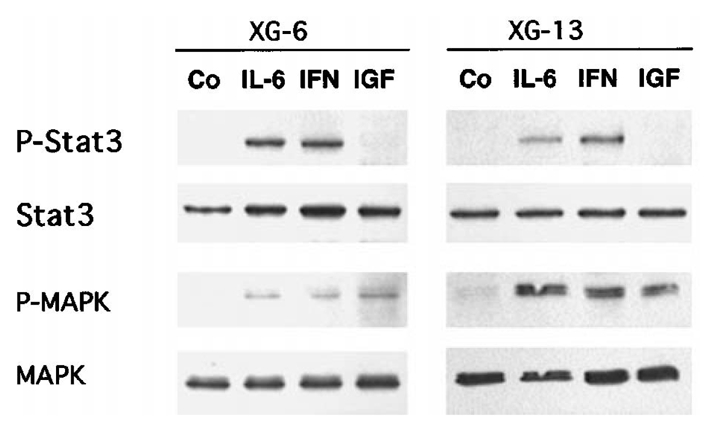
Myeloma cells were IL-6 and FCS starved for one hour and cultured with no cytokine (Co), 2 ng/mL IL-6 (IL-6), 200 U/mL IFN-α (IFN-α) or 100 ng/mL IGF-1 (IGF) in RPMI1640 and 1% BSA. Stat3 phosphorylation was analyzed by Western blot after 6 hours of culture using phospho-specific Stat3 antibody (P-Stat3), ERK1 and ERK2 phosphorylation after 15 minutes of culture using phospho-specific MAPK (P-MAPK). Blots were then stripped and reprobed for Stat3 or total MAPK. Western blots are for one representative experiment out of 3.