
Fig. 5. Metabolism of H3-DHEA by 1°MG.
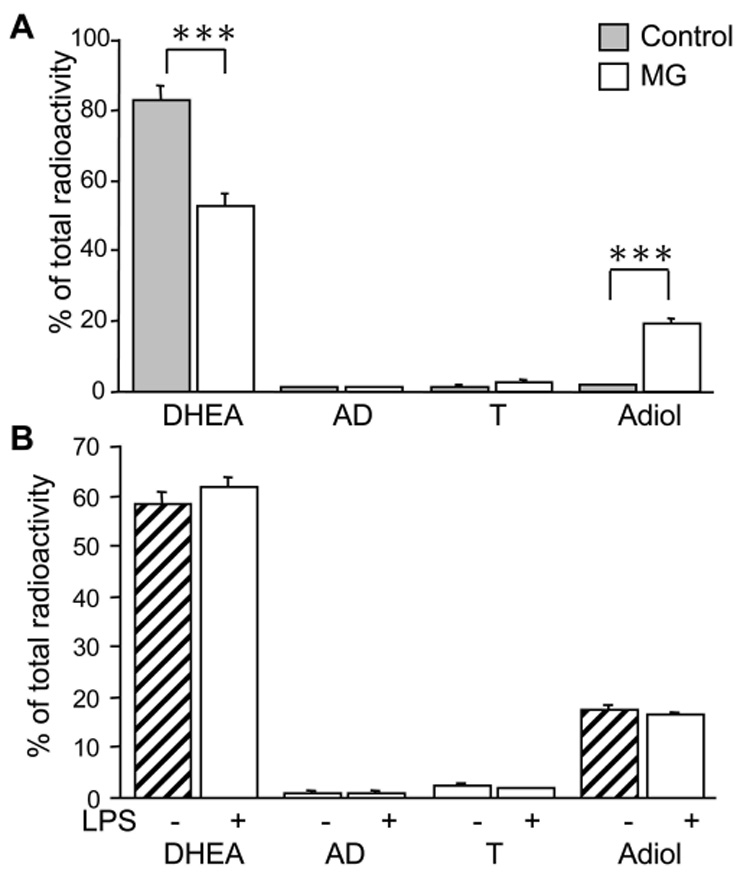
TLC analysis of H3-DHEA metabolism in 1°MG. Cells were incubated for 24hr with H3-DHEA and metabolites extracted from culture supernatants were resolved by TLC and counted on a scintillation counter. A) Resting microglia (MG, open bars) showed a significant conversion of DHEA compared to the no-cell controls (Control, grey bars), with the only product being Adiol. B) LPS (100ng/ml LPS+ 10ng/ml INFγ) stimulation of the cells (hatched bars) didn’t alter the metabolic activity or profile of steroids produced from DHEA in microglia. Bars represent the % of total H3 radioactivity collected from the TLC assay. Values are the mean ± the SEM of 2–3 independent experiments done in triplicate. ***, P < 0.0001 vs. MG.