
Fig. 6. 1°MG convert H3-AD into downstream steroids.
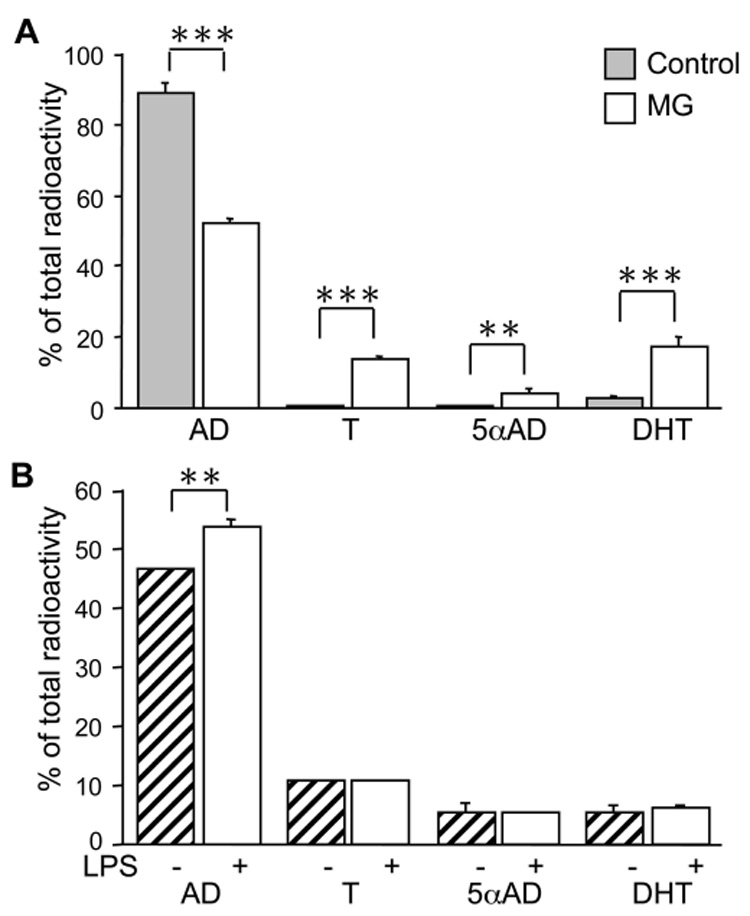
TLC analysis of H3-AD metabolism in 1°MG. Cells were incubated for 24hr with H3-AD and metabolites extracted from culture supernatants were resolved by TLC and counted on a scintillation counter. A) Resting microglia (MG, open bars) showed a significant conversion of AD compared to the no-cell controls (Control, grey bars). The main products of AD were testosterone (T), 5αAndrostanedione (5αAD), and dihydrotestosterone (DHT). B) LPS (100ng/ml LPS+ 10ng/ml INFγ) stimulation (hatched bars) slightly decreased the conversion of AD compared to vehicle treated cells (open bars), but not the production of downstream steroids. Bars represent the % of total H3 radioactivity collected from the TLC assay. Values are the mean ± the SEM of 2–3 independent experiments done in triplicate. **,***, P < 0.001, P < 0.0001 vs. MG, respectively.