
Figure 4.
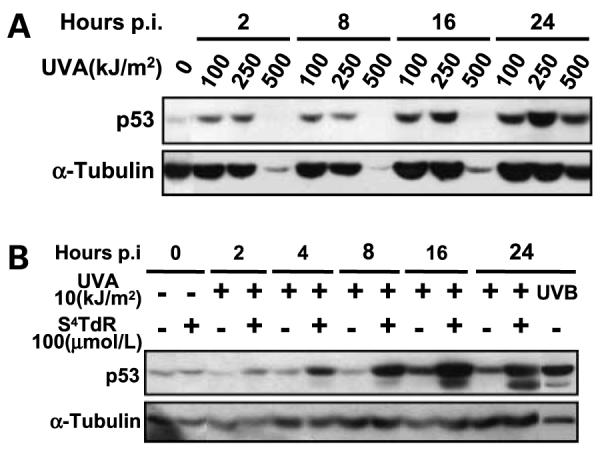
The p53 response to UVA and S4TdR/UVA treatment in HT1080 cells. Cells were treated as indicated on the figures and detailed in Materials and Methods. A, irradiation with UVA alone. B, treatment with 100 μmol/L of S4TdR or 10 kJ/m2 of UVA alone or in combination, or with 0.15 kJ/m2 of UVB, and then assayed by Western blot and probed for activation of p53. Blotting for the cytoskeleton protein α-tubulin was used as a loading control.