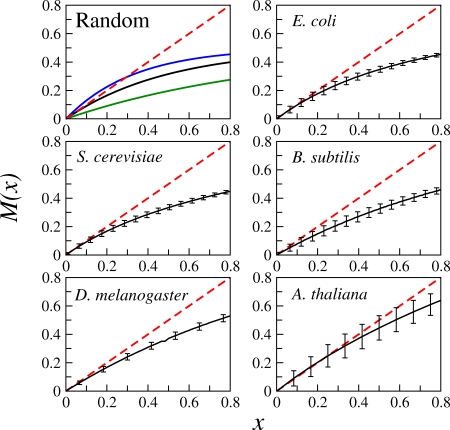
Figure 2. Critical dynamics in networks of real organisms.
Derrida curves exhibiting critical dynamical behavior in the genetic networks of five different organisms spanning four kingdoms of life: E. coli [46], S. cerevisiae [47], and B. subtilis [48], D. melanogaster [42] and A. thaliana [41]. Each point in the Derrida curve is the average over 20000 initial perturbations and the error bars indicate one standard deviation around this average. Additionally, the error bars in the curves of E. coli, B. subtilis and S. cerevisiae incorporate the uncertainty in the estimation of the p bias inferred from the microarray experiments. For comparison we show in the upper left corner three Derrida curves of randomly constructed networks with Poisson input topology operating in three dynamical regimes: Ordered (green), critical (black) and chaotic (blue). Note that criticality is characterized by the tangency of the Derrida curve to the identity close to x = 0.

