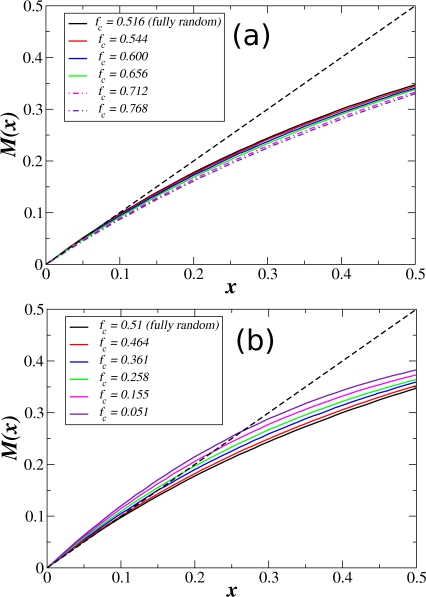
Figure 3. Critical dynamics in E. coli using canalizing functions.
Derrida map M(x) for the E. coli network with different fractions fc of canalizing functions. To compute fc we took into consideration only the genes for which K≥2. For fully random Boolean functions fc = 0.51. (a) We increased the value of fc by adding canalizing functions to the 230 genes with K≥4. Note that M(x) remains critical even for fc≈0.66, but it starts to deviate from criticality towards the ordered region for fc>0.7 (dotted dashed curves). (b) We decreased the value of fc by removing canalizing functions from the 421 genes which originally are regulated by canalizing functions just by chance (most of them with K = 2 and K = 3). In this case the curve deviates from criticality towards the chaotic region only for fc<0.4. Each point in the curves is the average over 5000 initial conditions randomly chosen.

