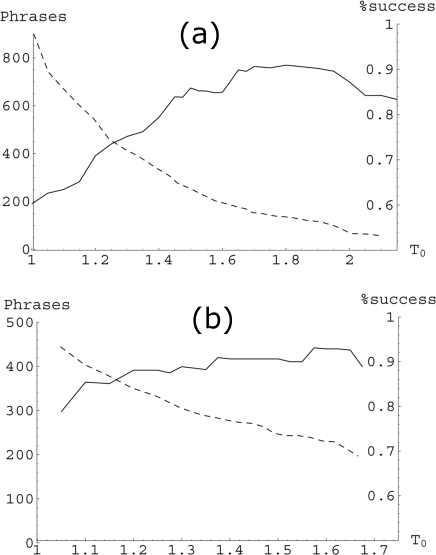
Figure 5. Inference success.
This figure shows the compromise between the inference success (solid line), and the total number of inferred phrases (dashed line) as functions of the threshold T 0 for (a) E. coli and (b) B. subtilis. Note that increasing the inference success decreases the number of inferred phrases. A compromise has to be established by adequately choosing T 0. We have chosen T 0 = 1.5 for E. coli and T 0 = 1.3 for B. subtilis.

