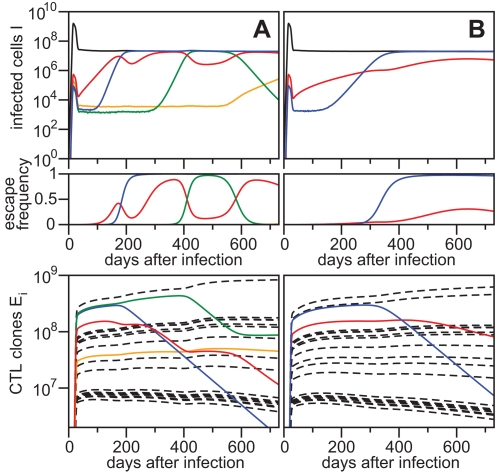
Figure 3. Immune Escape during the First Two Years after Infection.
In the top panels, the total number of infected cells (black line) is shown together with the emerging escape mutants (colored lines). Escape variants expressed as a frequency of the total viral population are given in the middle panels. These variants can fluctuate in frequency (e.g. red line) and, after dominating the viral population, revert back to wild-type (e.g. green line). In the bottom panels, a number of CTL clones proliferate upon infection (full and dashed lines) but can slowly disappear after the virus population escapes recognition (full colored lines). Starting with the same CTL repertoire, more escapes occur when killing of infected cells approaches mass-action dynamics (hk = 1012, shown in A) compared to Michaelis-Menten kinetics (hk = 109, shown in B).

